Amyloid Beta Protein

Human Synthetic Amyloid Beta Peptide 1-42 (HFIP treated)

Catalog No. SPR-485

0 out of 5 based on 0 customer ratings
Expression System N/A
Tags No tag
SKU: SPR-485 Category:

Clear
SPR-485_Amyloid-Beta-Peptide-1-42-HFIP-treated-Protein-TEM-3_panel.png
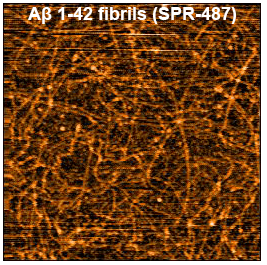
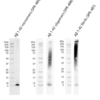
AFM of Amyloid Beta Peptide Protein (Monomers, Oligomers, and PFFS) (SPR-485, SPR-488, SPR-487)WB of Amyloid Beta Peptide Protein (Monomers, Oligomers, and PFFS) (SPR-485, SPR-488, SPR-487)Toxicity of Amyloid Beta Peptide Protein (Monomers, Oligomers, and PFFS) (SPR-485, SPR-488, SPR-487)
Product Name Amyloid Beta Protein
Description

Human Synthetic Amyloid Beta Peptide 1-42 (HFIP treated)

Applications WB, In vivo Assay, In vitro Assay
Concentration N/A - dried peptide film
Conjugates No tag
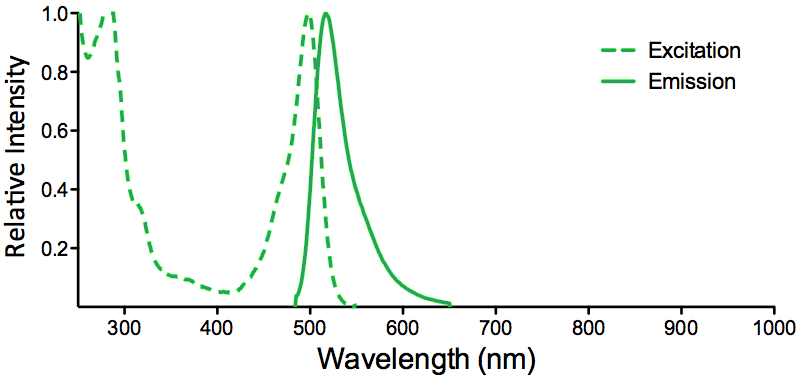
Dylight 488
Overview:

  • High fluorescence yield
  • High photostability
  • Less pH-sensitive
  • Excellent batch-to-batch reproducibility
  • Stringently QC tested
  • Molecular weight: 1011 g/mol

Dylight 488 Datasheet

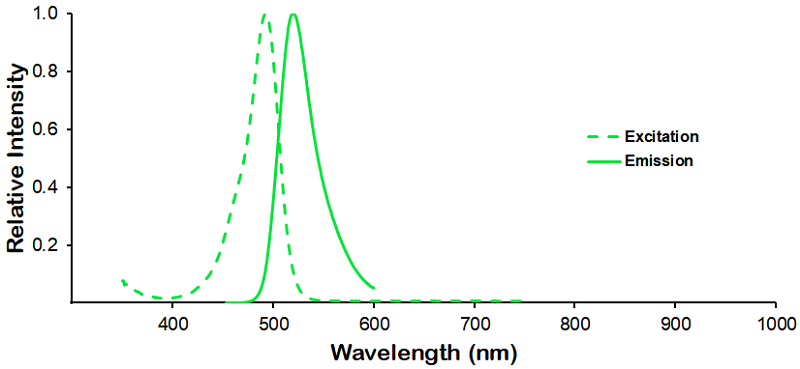
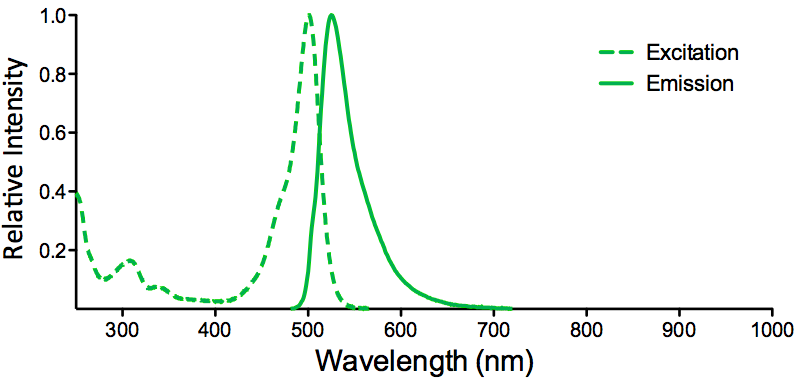
Dylight 488 Fluorophore Absorption and Emission Spectrum Optical Properties:

λex = 493 nm

λem = 518 nm

εmax = 7.0×10⁴

Laser = 488 nm


APC/Cy7
Overview:

  • High quantum yield
  • Excellent batch-to-batch reproducibility
  • Stringently QC tested

APC-Cy7 Datasheet


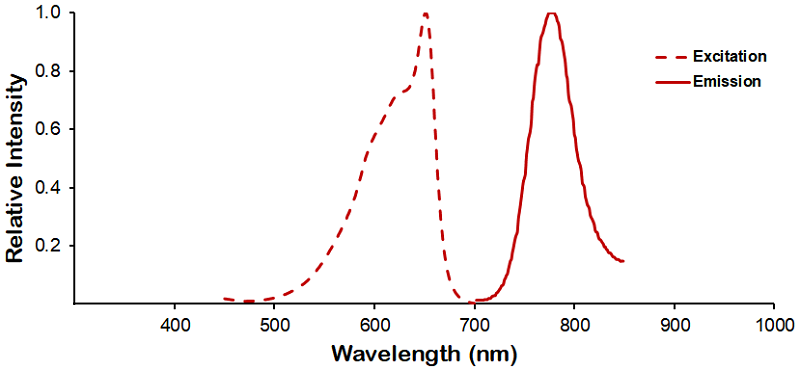
ACP-Cy7 Fluorophore Absorption and Emission Spectrum Optical Properties:

λex = 652 nm

λem = 790 nm

Laser = 594 or 633 nm


  Dylight 350
Overview:

  • High fluorescence intensity
  • High photostability
  • Less pH-sensitive
  • Excellent solubility in water
  • Stringently QC tested
  • Excellent batch-to-batch reproducibility
  • Molecular weight: 874 g/mol

Dylight 350 Datasheet

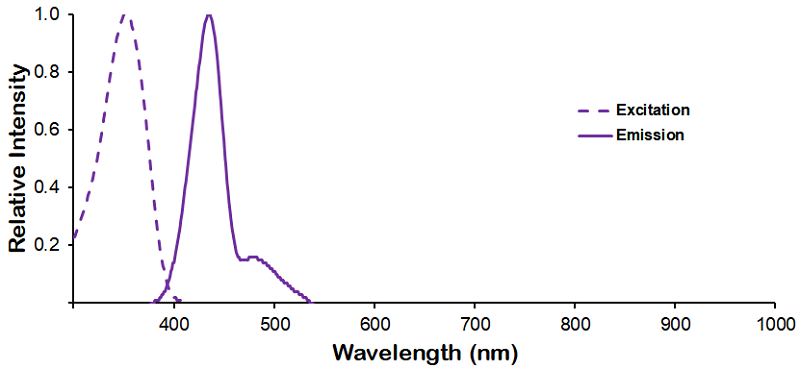
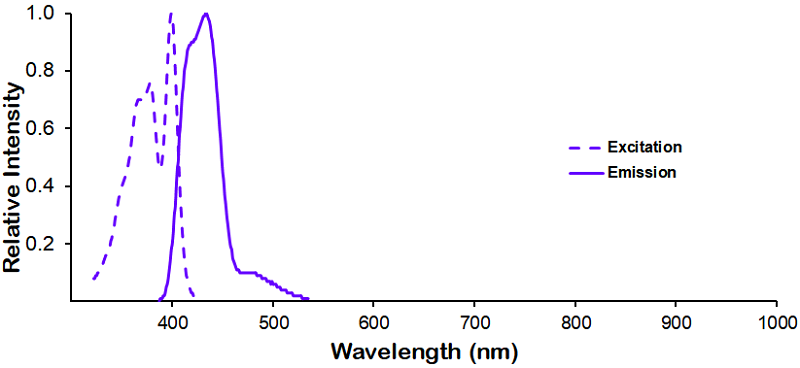
Dylight 350 Fluorophore Absorption and Emission Spectrum Optical Properties:

λex = 353 nm

λem = 432 nm

εmax = 1.5×10⁴


  Dylight 405
Overview:

  • High fluorescence intensity
  • High photostability
  • Less pH-sensitive
  • Excellent batch-to-batch reproducibility
  • Stringently QC tested
  • Molecular weight: 793 g/mol

Dylight 405 Datasheet

Dylight 405 Fluorophore Absorption and Emission Spectrum Optical Properties:

λex = 400 nm

λem = 420 nm

εmax = 3.0×10⁴

Laser = 405 nm


Dylight 594
Overview:

  • High fluorescence yield
  • High photostability
  • Less pH-sensitive
  • Excellent batch-to-batch reproducibility
  • Stringently QC tested
  • Molecular weight: 1078 g/mol

Dylight 594 Datasheet

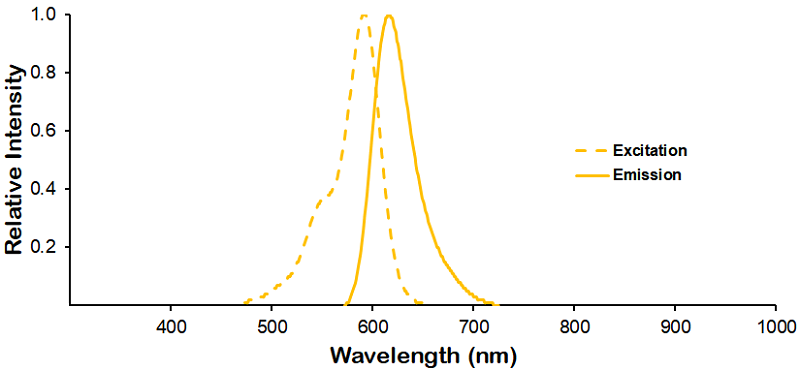
Dylight 594 Fluorophore Absorption and Emission Spectrum Optical Properties:

λex = 593 nm

λem = 618 nm

εmax = 8.0×10⁴

Laser = 526 nm


 Dylight 633
Overview:

  • High fluorescence yield
  • High photostability
  • Less pH-sensitive
  • Excellent batch-to-batch reproducibility
  • Stringently QC tested
  • Molecular weight: 1066 g/mol

Dylight 633 Datasheet

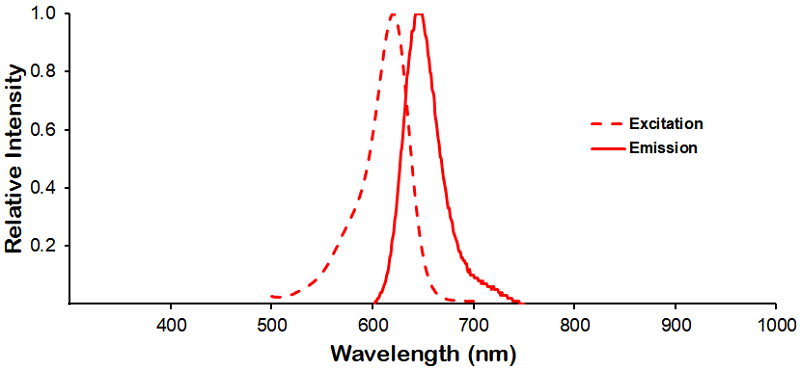
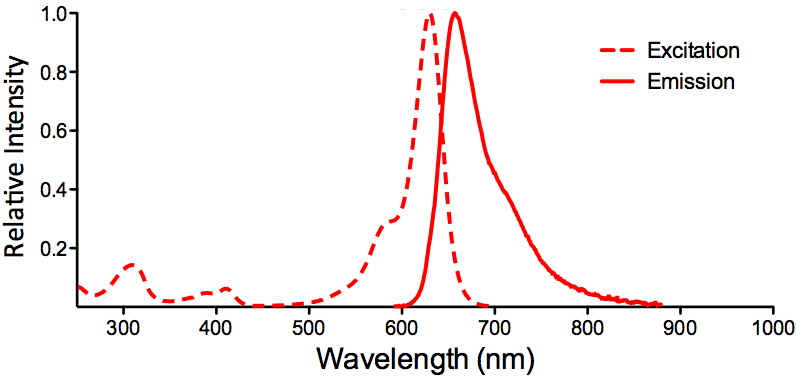
Dylight 633 Fluorophore Absorption and Emission Spectrum Optical Properties:

λex = 638 nm

λem = 658 nm

εmax = 1.7×10⁵

Laser = 633 nm


 PerCP 
Overview:

  • Peridinin-Chlorophyll-Protein Complex
  • Small phycobiliprotein
  • Isolated from red algae
  • Large stokes shift (195 nm)
  • Molecular Weight: 35 kDa

PerCP Datasheet

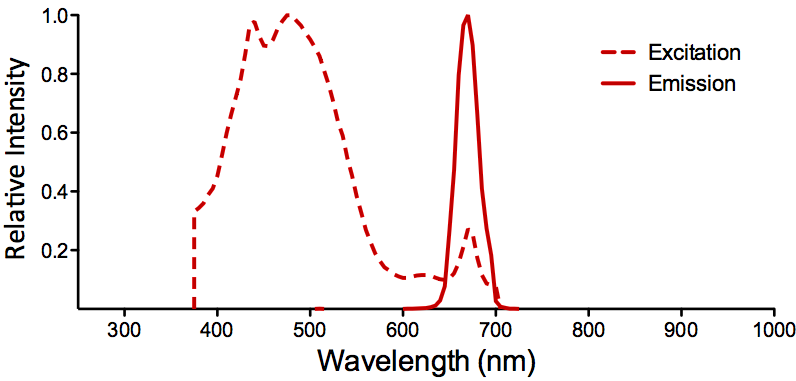
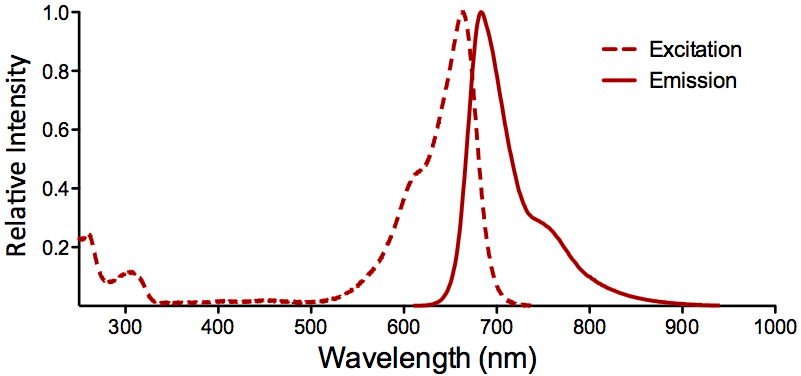
 PerCP Fluorophore Absorption and Emission Spectrum Optical Properties:

λex = 482 nm

λem = 677 nm

εmax = 1.96 x 10⁶

Laser = 488 nm


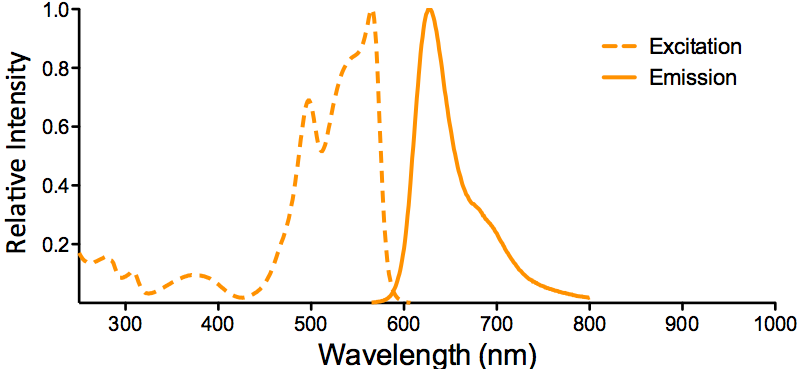
 PE/ATTO 594
PE/ATTO 594 is a tandem conjugate, where PE is excited at 535 nm and transfers energy to ATTO 594 via FRET (fluorescence resonance energy transfer), which emits at 627 nm.
Overview:

  • High fluorescence yield
  • High photostability
  • Very hydrophilic
  • Excellent solubility in water
  • Very little aggregation

PE/ATTO 594 Datasheet

PE-ATTO 594 Fluorophore Conjugate Excitation and Emission Spectra Optical Properties:

λex = 535 nm

λem = 627 nm

Laser = 488 to 561 nm


  FITC (Fluorescein)
Overview:

  • Excellent fluorescence quantum yield
  • High rate of photobleaching
  • Good solubility in water
  • Broad emission spectrum
  • pH dependent spectra
  • Molecular formula: C20H12O5
  • Molar mass: 332.3 g/mol

FITC-Fluorescent-conjugate

FITC Fluorescein Fluorophore Excitation and Emission Spectra Optical Properties:

λex = 494 nm

λem = 520 nm

εmax = 7.3×10⁴

Φf = 0.92

τfl = 5.0 ns

Brightness = 67.2

Laser = 488 nm

Filter set = FITC


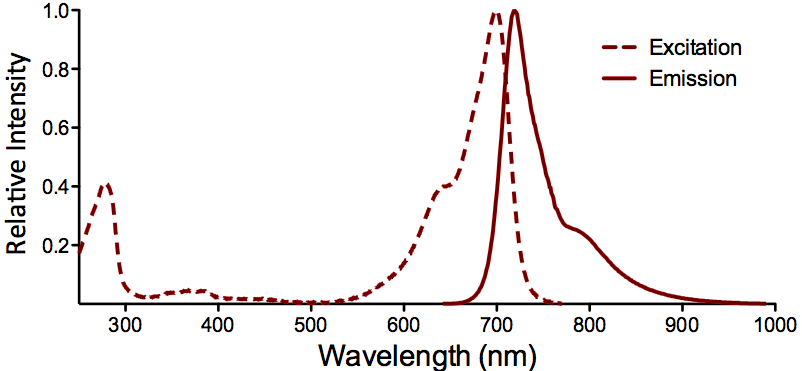
 ATTO 700
Overview:

  • High fluorescence yield
  • Excellent thermal and photostability
  • Quenched by electron donors
  • Very hydrophilic
  • Good solubility in polar solvents
  • Zwitterionic dye
  • Molar Mass: 575 g/mol

ATTO 700 Datasheet

 ATTO 700 Fluorophore Absorption and Emission Spectrum Optical Properties:

λex = 700 nm

λem = 719 nm

εmax = 1.25×10⁵

Φf = 0.25

τfl = 1.6 ns

Brightness = 31.3

Laser = 676 nm

Filter set = Cy®5.5


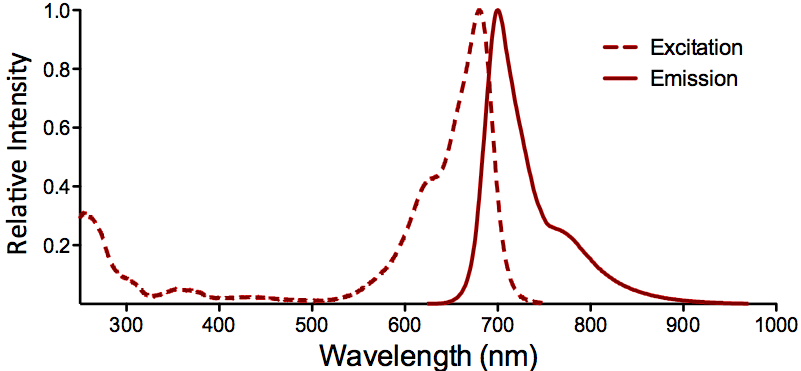
 ATTO 680
Overview:

  • High fluorescence yield
  • Excellent thermal and photostability
  • Quenched by electron donors
  • Very hydrophilic
  • Good solubility in polar solvents
  • Zwitterionic dye
  • Molar Mass: 631 g/mol

ATTO 680 Datasheet

 ATTO 680 Fluorophore Absorption and Emission Spectrum Optical Properties:

λex = 680 nm

λem = 700 nm

εmax = 1.25×10⁵

Φf = 0.30

τfl = 1.7 ns

Brightness = 37.5

Laser = 633 – 676 nm

Filter set = Cy®5.5


 ATTO 655
Overview:

  • High fluorescence yield
  • High thermal and photostability
  • Excellent ozone resistance
  • Quenched by electron donors
  • Very hydrophilic
  • Good solubility in polar solvents
  • Zwitterionic dye
  • Molar Mass: 634 g/mol

ATTO 655 Datasheet

ATTO 655 Fluorophore Absorption and Emission Spectrum Optical Properties:

λex = 663 nm

λem = 684 nm

εmax = 1.25×10⁵

Φf = 0.30

τfl = 1.8 ns

Brightness = 37.5

Laser = 633 – 647 nm

Filter set = Cy®5


 ATTO 633
Overview:

  • High fluorescence yield
  • High thermal and photostability
  • Moderately hydrophilic
  • Good solubility in polar solvents
  • Stable at pH 4 – 11
  • Cationic dye, perchlorate salt
  • Molar Mass: 652.2 g/mol

ATTO 633 Datasheet

ATTO 633 Fluorophore Absorption and Emission Spectrum Optical Properties:

λex = 629 nm

λem = 657 nm

εmax = 1.3×10⁵

Φf = 0.64

τfl = 3.2 ns

Brightness = 83.2

Laser = 633 nm

Filter set = Cy®5


 ATTO 594
Overview:

  • High fluorescence yield
  • High photostability
  • Very hydrophilic
  • Excellent solubility in water
  • Very little aggregation
  • New dye with net charge of -1
  • Molar Mass: 1137 g/mol

ATTO 594 Datasheet

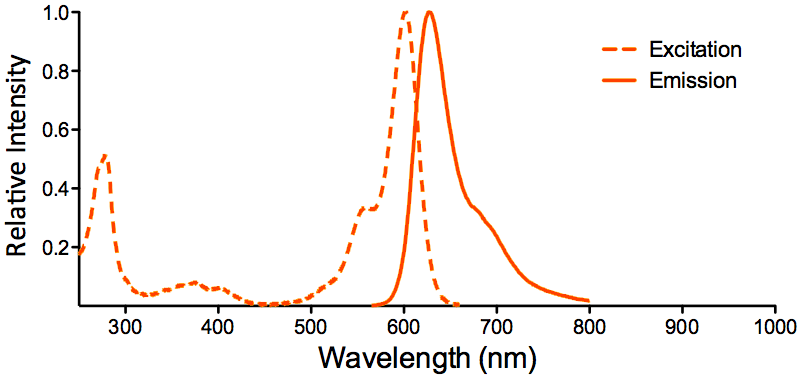
 ATTO 594 Fluorophore Excitation and Emission Spectrum Optical Properties:

λex = 601 nm

λem = 627 nm

εmax = 1.2×10⁵

Φf = 0.85

τfl = 3.5 ns

Brightness = 102

Laser = 594 nm

Filter set = Texas Red®


 ATTO 565
Overview:

  • High fluorescence yield
  • High thermal and photostability
  • Good solubility in polar solvents
  • Excellent solubility in water
  • Very little aggregation
  • Rhodamine dye derivative
  • Molar Mass: 611 g/mol

ATTO 565 Datasheet

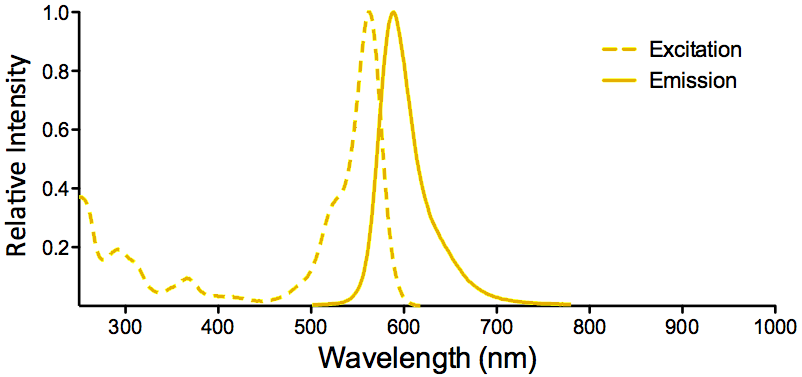
 ATTO 565 Fluorophore Excitation and Emission Spectra Optical Properties:

λex = 563 nm

λem = 592 nm

εmax = 1.2×10⁵

Φf = 0.9

τfl = 3.4 n

Brightness = 10

Laser = 532 nm

Filter set = TRITC


  ATTO 488
Overview:

  • High fluorescence yield
  • High photostability
  • Very hydrophilic
  • Excellent solubility in water
  • Very little aggregation
  • New dye with net charge of -1
  • Molar Mass: 804 g/mol 

ATTO 488 Datasheet

  ATTO 488 Fluorophore Excitation and Emission Spectra Optical Properties:

λex = 501 nm

λem = 523 nm

εmax = 9.0×10⁴

Φf = 0.80

τfl = 4.1 ns

Brightness = 72

Laser = 488 nm

Filter set = FITC


  ATTO 390
Overview:

  • High fluorescence yield
  • Large Stokes-shift (89 nm)
  • Good photostability
  • Moderately hydrophilic
  • Good solubility in polar solvents
  • Coumarin derivate, uncharged
  • Low molar mass: 343.42 g/mol 

ATTO 390 Datasheet

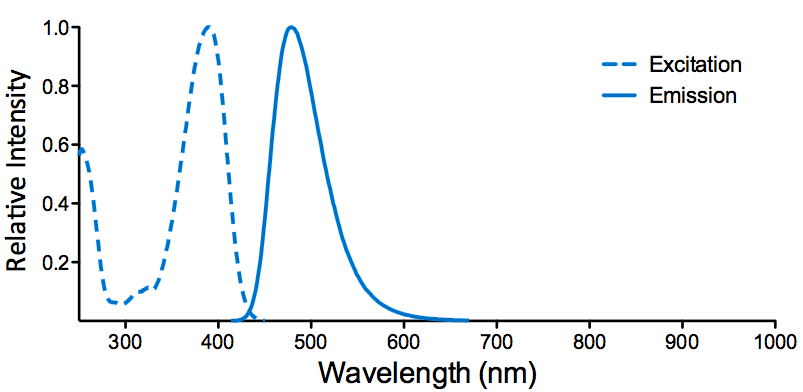
ATTO 390 Fluorescent Dye Excitation and Emission Spectra Optical Properties:

λex = 390 nm

λem = 479 nm

εmax = 2.4×10⁴

Φf = 0.90

τfl = 5.0 ns

Brightness = 21.6

Laser = 365 or 405 nm


APC (Allophycocyanin)
Overview:

  • High quantum yield
  • Large phycobiliprotein
  • 6 chromophores per molecule
  • Isolated from red algae
  • Molecular Weight: 105 kDa

APC Datasheet

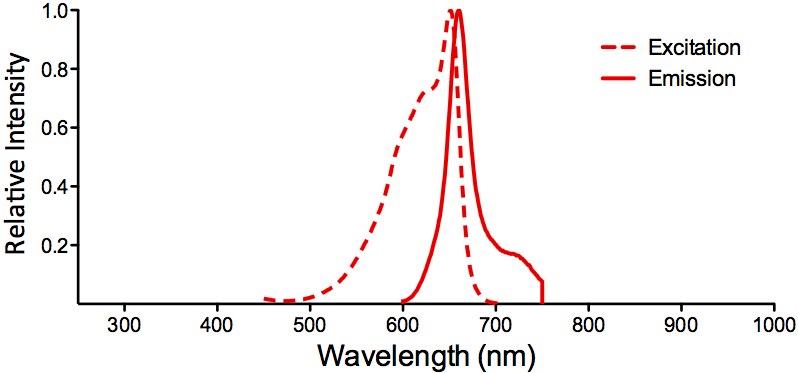
 APC Fluorophore Absorption and Emission Spectrum Optical Properties:

λex = 650 nm

λem = 660 nm

εmax = 7.0×10⁵

Φf = 0.68

Brightness = 476

Laser = 594 or 633 nm

Filter set = Cy®5


Streptavidin

Properties:

  • Homo-tetrameric protein purified from Streptomyces avidinii which binds four biotin molecules with extremely high affinity
  • Molecular weight: 53 kDa
  • Formula: C10H16N2O3S
  • Applications: Western blot, immunohistochemistry, and ELISA

Streptavidin Datasheet

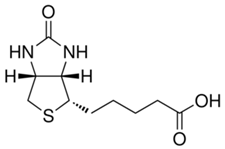
BiotinBiotin Conjugate Structure

Properties:

  • Binds tetrameric avidin proteins including Streptavidin and neuravidin with very high affinity
  • Molar mass: 244.31 g/mol
  • Formula: C10H16N2O3S
  • Applications: Western blot, immunohistochemistry, and ELISA

Biotin Datasheet

HRP (Horseradish peroxidase)

Properties:

  • Enzymatic activity is used to amplify weak signals and increase visibility of a target
  • Readily combines with hydrogen peroxide (H2O2) to form HRP-H2O2 complex which can oxidize various hydrogen donors
  • Catalyzes the conversion of:
    • Chromogenic substrates (e.g. TMB, DAB, ABTS) into coloured products
    • Chemiluminescent substrates (e.g. luminol and isoluminol) into light emitting products via enhanced chemiluminescence (ECL)
    • Fluorogenic substrates (e.g. tyramine, homovanillic acid, and 4-hydroxyphenyl acetic acid) into fluorescent products
  • High turnover rate enables rapid generation of a strong signal
  • 44 kDa glycoprotein
  • Extinction coefficient: 100 (403 nm)
  • Applications: Western blot, immunohistochemistry, and ELISA

HRP Datasheet

AP (Alkaline Phosphatase)

Properties:

  • Broad enzymatic activity for phosphate esters of alcohols, amines, pyrophosphate, and phenols
  • Commonly used to dephosphorylate the 5’-termini of DNA and RNA to prevent self-ligation
  • Catalyzes the conversion of:
    • Chromogenic substrates (e.g. pNPP, naphthol AS-TR phosphate, BCIP) into coloured products
    • Fluorogenic substrates (e.g. 4-methylumbelliferyl phosphate) into fluorescent products
  • Molecular weight: 140 kDa
  • Applications: Western blot, immunohistochemistry, and ELISA

AP Datasheet

  R-PE (R-Phycoerythrin)
Overview:

  • Broad excitation spectrum
  • High quantum yield
  • Photostable
  • Member of the phycobiliprotein family
  • Isolated from red algae
  • Excellent solubility in water
  • Molecular Weight: 250 kDa

R-PE Datasheet

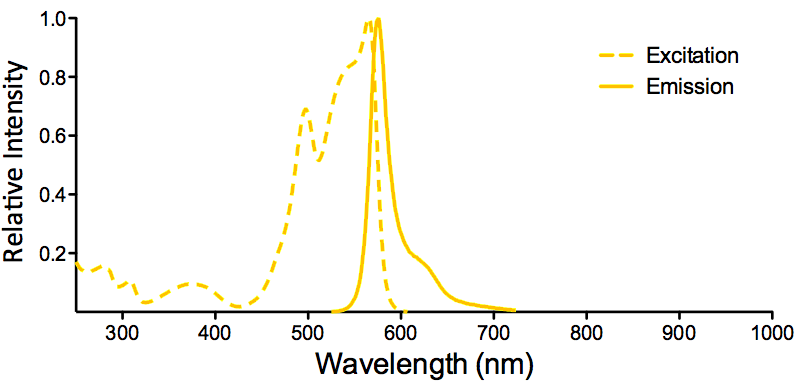
 R-PE Fluorophore Excitation and Emission Spectra Optical Properties:

λex = 565 nm

λem = 575 nm

εmax = 2.0×10⁶

Φf = 0.84

Brightness = 1.68 x 10³

Laser = 488 to 561 nm

Filter set = TRITC


Nature Synthetic
Species Human
Expression System N/A
Amino Acid Sequence DAEFRHDSGYEVHHQKLVFFAEDVGSNKGAIIGLMVGGVVIA
Purity >98%
Other Resources Protocol for re-suspension of Amyloid Beta Peptide 1-42
Protein Length 42 amino acids
Protein Size 4.5 kDa
Field of Use Not for use in humans. Not for use in diagnostics or therapeutics. For in vitro research use only.

Properties

Storage Buffer Dry powder. See "Other Resources" for re-suspension instructions/protocol.
Storage Temperature -80ºC
Shipping Temperature Blue Ice or 4ºC
Purification N/A
Cite This Product Human Synthetic Amyloid Beta Peptide (StressMarq Biosciences Inc., Victoria BC CANADA, Catalog # SPR-485)
Certificate of Analysis Certified >98% pure using mass spec and HPLC.
Other Relevant Information For corresponding PFFs, see catalog# SPR-487. For oligomers, see catalog# SPR-488.

Biological Description

Alternative Names Abeta Protein, Abeta peptide, Amyloid beta peptide, Beta amyloid peptide, amyloid beta precursor protein peptide, APP
Research Areas Alzheimer's Disease, Amyloid, Neurodegeneration, Neuroscience
Cellular Localization Cell membrane, Intracellular Vesicles
Gene ID 351
Swiss Prot P05067
Scientific Background Our amyloid beta peptide 1-42 (Aβ42) is produced synthetically and treated with 1,1,1,3,3,3-Hexafluoro-2-propanol (HFIP) prior to drying which breaks down pre-formed fibrils and monomerizes the peptide, as previously published (1,2). Upon resuspension in Ammonium hydroxide (NH4OH), our Aβ42 presents as a monomeric peptide without fibrils when observed under TEM, AFM and on a Western Blot with an anti-amyloid beta antibody. In contrast to AB42 oligomer and fibril constructs, our Aβ42 monomers were not toxic to primary rat cortical neurons. In the brain, amyloid beta peptide (Aβ) is generated by protease cleavage of amyloid precursor protein (APP), which aggregates into oligomers, protofibrils, fibrils and ultimately plaques in neurodegenerative diseases. The accumulation of Aβ plaques in the brain is considered a hallmark of Alzheimer’s disease (AD), and most of the drugs tested for AD in the past 20 years have targeted amyloid beta accumulation (3). Soluble Aβ oligomers isolated from the brains of AD patients or those generated in vitro potently impaired synapse structure and function (4). Aβ oligomers generated in vitro were toxic to PC12 cells (2) and SH-SY5Y cells (5). Aβ was demonstrated to interact with tauopathies to affect neurodegeneration in AD patients (6) and accumulations of Aβ were shown to be associated with lower survival rates in Parkinson’s disease patients with dementia (7).
References 1. Stine et al. 2003. JBC. 278(13):11612-22. doi: 10.1074/jbc.M210207200
2. Chromy et al. 2003. Biochemistry. 42:12749-12760. doi: 10.1021/bi030029q
3. Panza et al. 2019. Nat Rev Neurol. 15:73-88 https://doi.org/10.1038/s41582-018-0116-6
4. Shankar et al. 2008. Nat Med. 14(8):837-842. doi: 10.1038/nm1782
5. Kayed et al. 2003. Science. 300(5618): 486-489. doi: 10.1126/science.1079469
6. Want et al. 2016. JAMA Neurol. 73(9):1070-7. doi: 10.1001/jamaneurol.2016.2078
7. Kotzbauer et al. 2012. Arch Neurol. 69(10): 1326-1331. doi: 10.1001/archneurol.2012.1608

Product Images

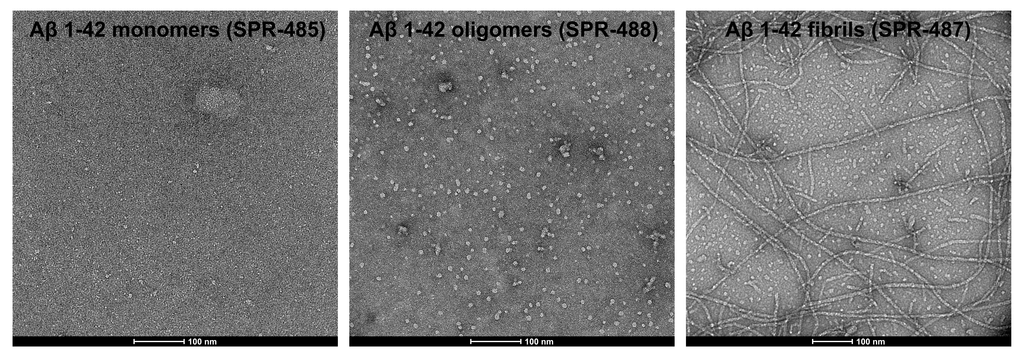
<p>TEM of amyloid beta 1-42 monomers (SPR-485, left), oligomers (SPR-488, middle) and fibrils (SPR-487, right). Negative stain transmission electron microscopy images acquired at 80 Kv on carbon coated 400 mesh copper grids using phosphotungstic acid and uranyl acetate stain. Scale bar = 100 nm.</p>

TEM of amyloid beta 1-42 monomers (SPR-485, left), oligomers (SPR-488, middle) and fibrils (SPR-487, right). Negative stain transmission electron microscopy images acquired at 80 Kv on carbon coated 400 mesh copper grids using phosphotungstic acid and uranyl acetate stain. Scale bar = 100 nm.

<p>AFM of amyloid beta 1-42 monomers (SPR-485, left), oligomers (SPR-488, middle) and fibrils (SPR-487, right). Atomic force microscopy analysis of 1.0 mg/mL samples diluted to 0.1 mg/mL in dH2O, mounted on freshly cleaved mica, washed, dried and analyzed with tapping mode. Representative images are 2.5 x 2.5 µm x-y with a z-range of 10 nm.</p>

AFM of amyloid beta 1-42 monomers (SPR-485, left), oligomers (SPR-488, middle) and fibrils (SPR-487, right). Atomic force microscopy analysis of 1.0 mg/mL samples diluted to 0.1 mg/mL in dH2O, mounted on freshly cleaved mica, washed, dried and analyzed with tapping mode. Representative images are 2.5 x 2.5 µm x-y with a z-range of 10 nm.
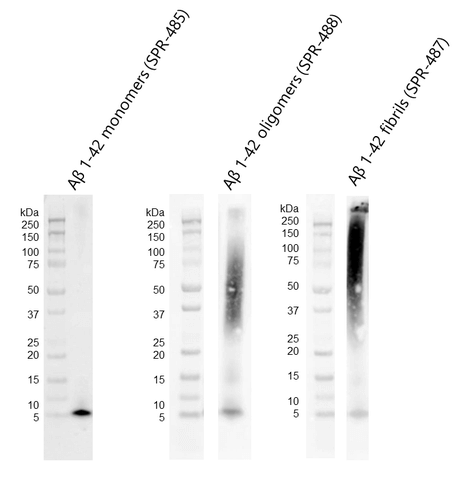
<p>Western blot of amyloid beta 1-42 monomers (SPR-485, left), oligomers (SPR-488, middle) and fibrils (SPR-487, right) using anti-amyloid beta 6E10 antibody. Amyloid beta constructs at 160 pmol were run on 4-12% Bis-Tris SDS-PAGE, transferred to nitrocellulose in the presence of 0.02% v/v Tween-20, and blotted with 1:1000 mouse 6E10 primary antibody (Biolegend). Oligomers observed under TEM/AFM appear as distinct dimer/trimer bands at ~37-75 kDa on Western Blot with 6E10 antibody (middle). Fibrils observed under TEM/AFM appear as a distinct signal at greater than 100 kDa in the stacking gel (right).</p>

Western blot of amyloid beta 1-42 monomers (SPR-485, left), oligomers (SPR-488, middle) and fibrils (SPR-487, right) using anti-amyloid beta 6E10 antibody. Amyloid beta constructs at 160 pmol were run on 4-12% Bis-Tris SDS-PAGE, transferred to nitrocellulose in the presence of 0.02% v/v Tween-20, and blotted with 1:1000 mouse 6E10 primary antibody (Biolegend). Oligomers observed under TEM/AFM appear as distinct dimer/trimer bands at ~37-75 kDa on Western Blot with 6E10 antibody (middle). Fibrils observed under TEM/AFM appear as a distinct signal at greater than 100 kDa in the stacking gel (right).
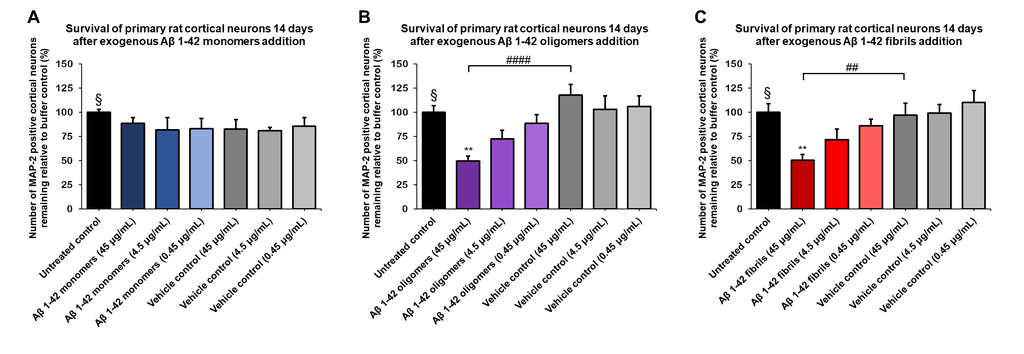
<p>Amyloid beta 1-42 oligomers (SPR-488) and fibrils (SPR-487) show a dose-dependent toxicity to primary rat cortical neurons, but not monomers (SPR-485). Survival of rat primary cortical neurons 14 days after treatment with different concentrations of (A) monomers, (B) oligomers or (C) fibrils quantified by MAP2 positive neurons and expressed as a percentage of control. Fibrils and respective vehicle controls were initially sonicated in a Bioruptor. Test conditions were run in the same plate as untreated control and vehicle controls, which consisted of buffer without amyloid beta 1-42 protein. Data expressed as mean +/- s.e.m. (n=6). A global analysis of the data was performed using a one-way ANOVA followed by Dunnett’s test; ** p<0.01 stats vs control; ## p<0.01, #### p<0.0001 stats vs vehicle control. § represents untreated control condition.
</p>

Amyloid beta 1-42 oligomers (SPR-488) and fibrils (SPR-487) show a dose-dependent toxicity to primary rat cortical neurons, but not monomers (SPR-485). Survival of rat primary cortical neurons 14 days after treatment with different concentrations of (A) monomers, (B) oligomers or (C) fibrils quantified by MAP2 positive neurons and expressed as a percentage of control. Fibrils and respective vehicle controls were initially sonicated in a Bioruptor. Test conditions were run in the same plate as untreated control and vehicle controls, which consisted of buffer without amyloid beta 1-42 protein. Data expressed as mean +/- s.e.m. (n=6). A global analysis of the data was performed using a one-way ANOVA followed by Dunnett’s test; ** p<0.01 stats vs control; ## p<0.01, #### p<0.0001 stats vs vehicle control. § represents untreated control condition.

Reviews

Reviews

There are no reviews yet.

Be the first to review “Amyloid Beta Protein”

Your email address will not be published. Required fields are marked *